PSY 652: Research Methods in Psychology I
Random Sampling
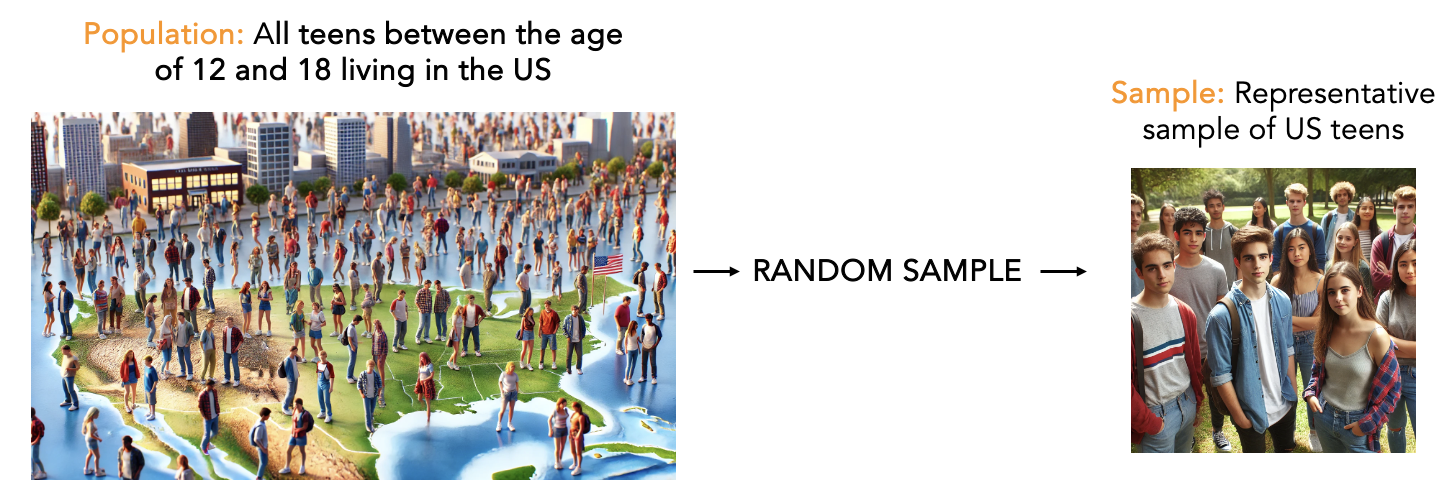
A population and a random sample

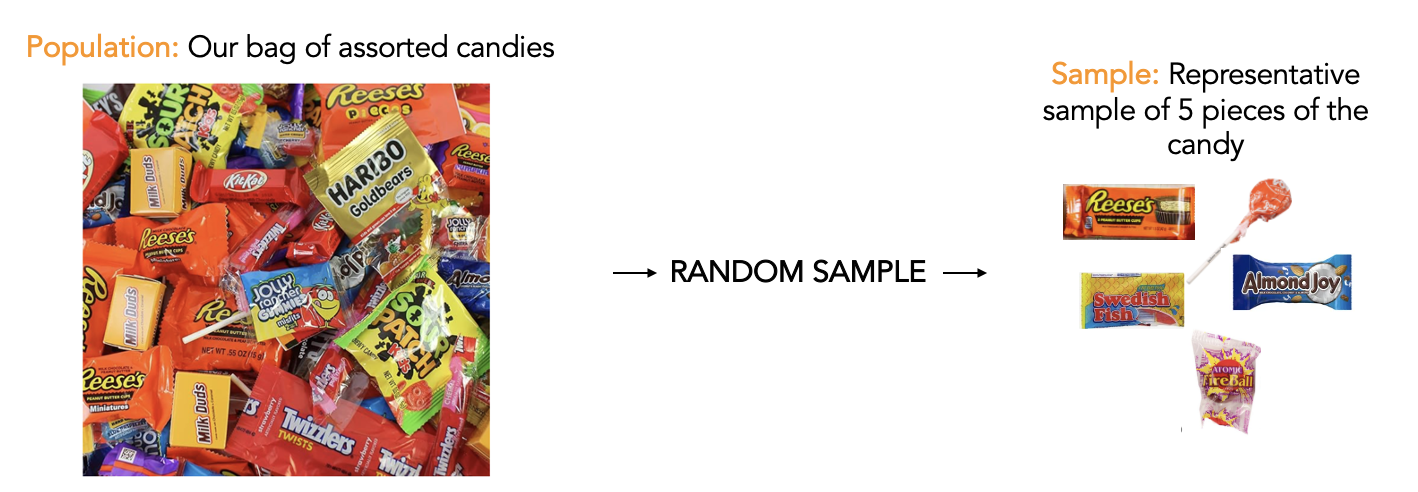
Our bag of candy analogy

Candy data
Let’s import the candy data population.
Full data frame of candy population data to peruse
A density plot of the population distribution
The population parameter
Let’s imagine that the population parameter of interest is the weight of the 100 pieces of candy. Since, in this example, we have the whole population, we can simply calculate the population parameter.
The pull() function extracts the result (i.e., the sum representing the total weight of all 100 candies) as a simple numeric value. This value is then stored in the population_weight object, allowing us to refer to it by name later in our analysis. This makes it easy to use in subsequent calculations or visualizations (as you’ll soon see).
The samples that you drew
To begin, let’s consider the samples that students drew from the population.
Each sample of 5 candies that students drew represents one sample drawn from the population. For each of your samples, let’s calculate the mean of the 5 candies, then multiply that mean by 100 to estimate the parameter (i.e., compute the parameter estimate or sample statistic).
First import the student samples
Full data frame of student samples to peruse
Now compute the parameter estimates
This code calculates the estimated total weight of 100 candies based on student-drawn samples. It starts by taking the student_samples data frame and grouping the data by the name column, which identifies each student’s sample. For each group, the mean weight of the candies in that sample is calculated, producing a new column called mean_sample_weight. The code then estimates the total weight of all 100 candies by multiplying the mean sample weight by 100 (since there are 100 candies in the population), storing this result in a new column called estimated_bag_weight.
Create a density plot of parameter estimates from student samples
The data generating process
What was the data generating process for your sample?
What if we drew random samples instead?
The rep_slice_sample() function from the infer package is used to repeatedly draw random samples from a data frame. In this case, it is drawing 17 samples (to match the 17 student samples), each containing 5 candies (i.e., n = 5 and reps = 17). This simulates multiple random samples from the population. A new variable called “replicate” is created, which denotes each randomly drawn sample.
Create a density plot of parameter estimates from random samples
Reflections
What are the benefits of random sampling?
What are the risks of NOT random sampling?
Key observations
Simple random sampling (like the kind employed here) ensures that each member of the population has an equal chance of being selected.
Random sampling helps to produce parameter estimates that are representative of the population.
Employing a random sampling methodology is critical if the goal is to estimate a population parameter. (Although model-based approaches or post-stratification can be used to correct for sampling bias and still obtain estimates of population parameters).