PSY 652: Research Methods in Psychology I

Welcome

Kimberly L. Henry: kim.henry@colostate.edu

Get to know your neighbors

An image depicting commonalities among group members.

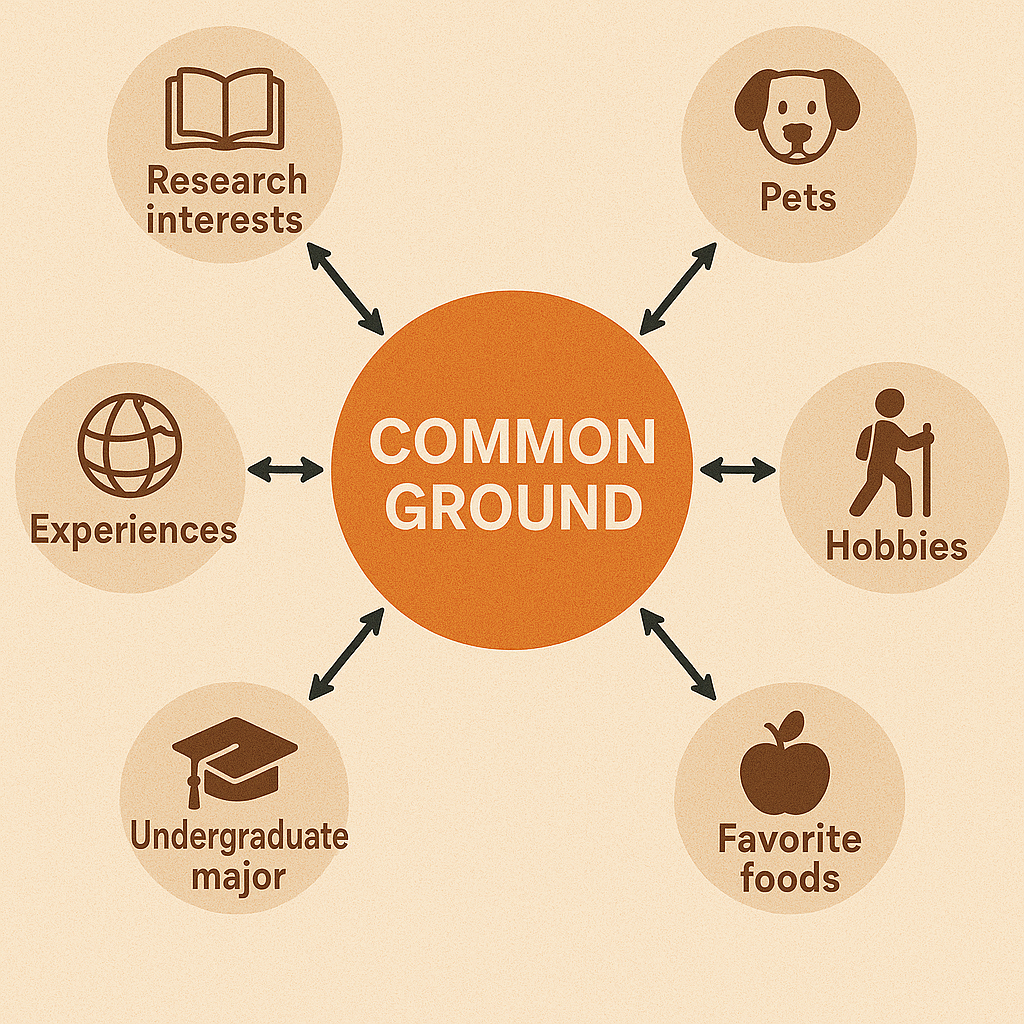
Let’s start with your passion


An image depicting a piece of paper in 4 quadrants.

Sketch your data story1 (part 1)

On the top left quadrant of your paper, write down the problem that motivates your current research (or the research you seek to pursue at CSU).


If you prefer a prompt, try filling in these blanks:


We need to find out ______ in order to _________.


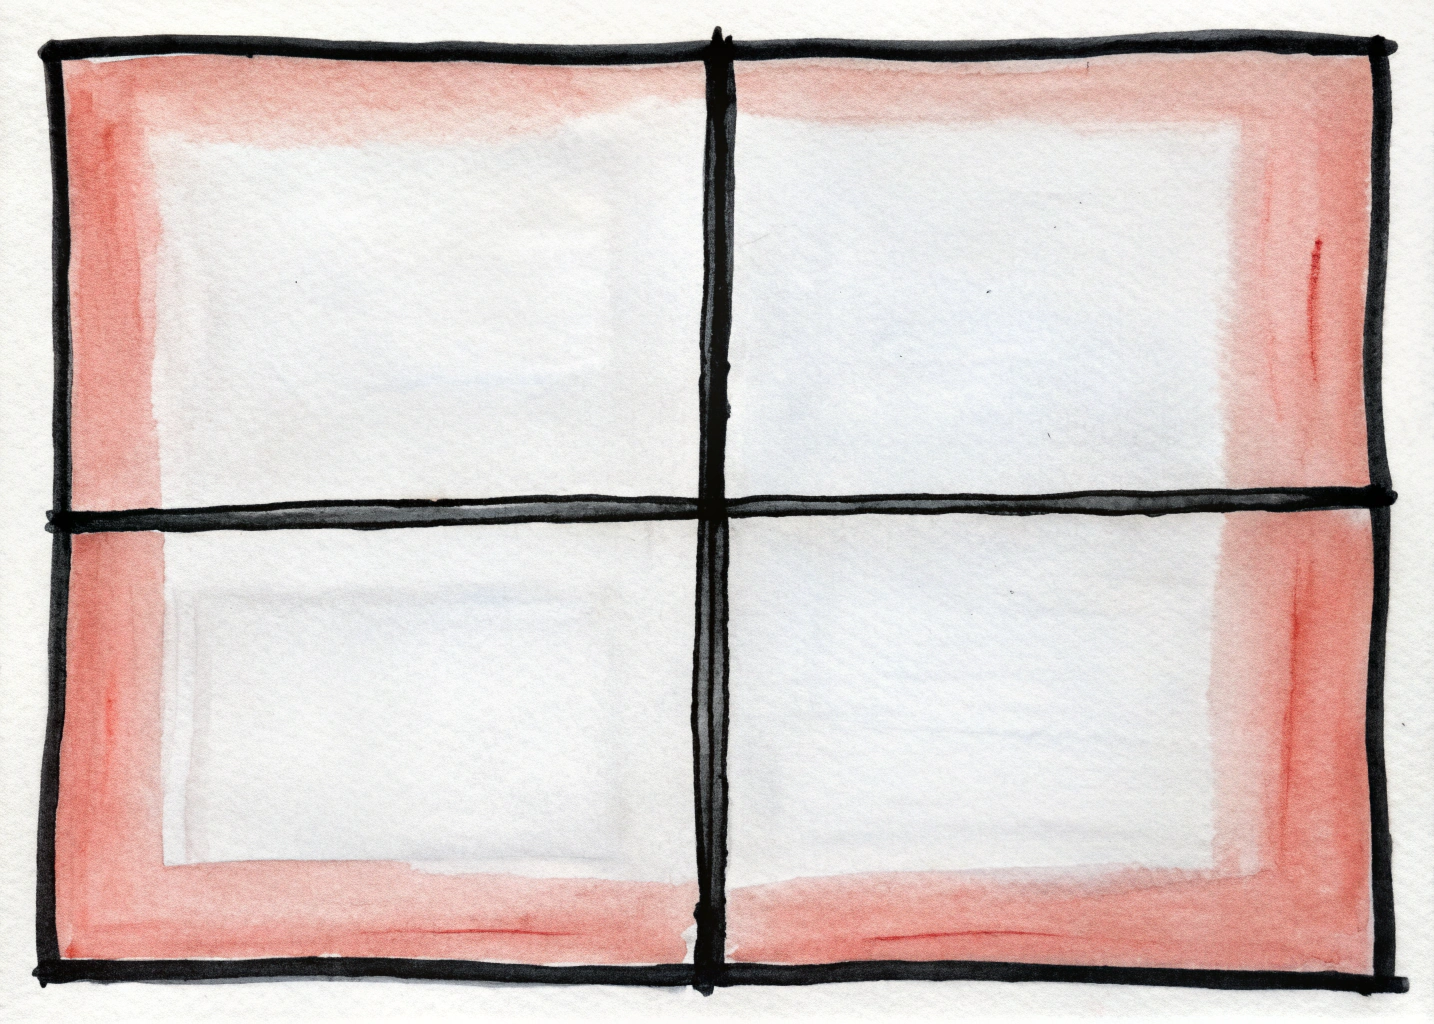
Sketch your data story (part 2)

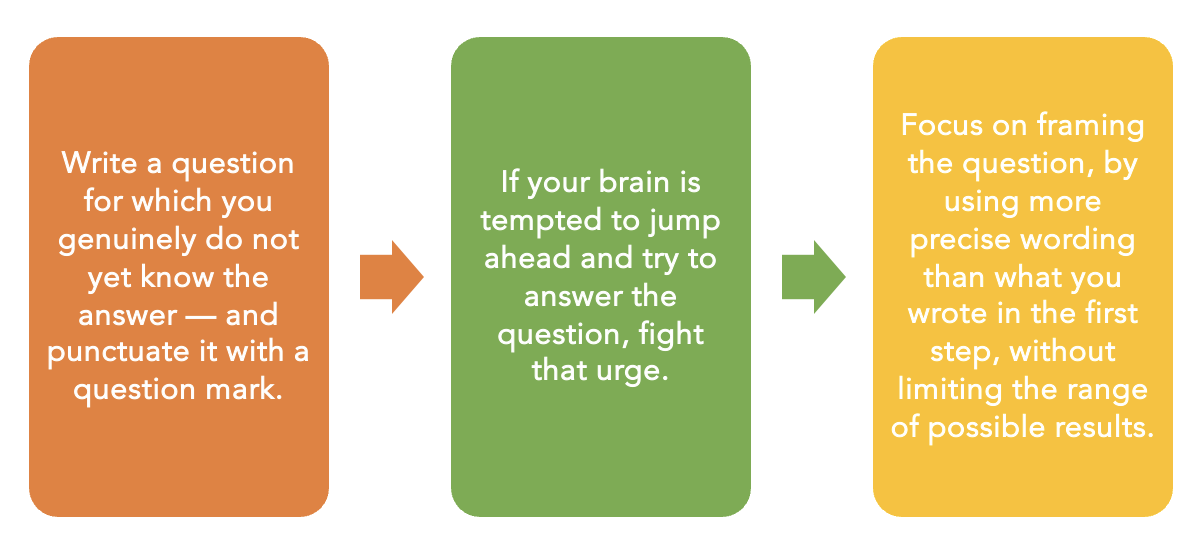
In the top right quadrant of your paper, rewrite the problem into a question.

Sketch your data story (part 3)

In the bottom left quadrant of your paper, draw pictures and arrows to show how you’ll find data to answer your question.

  • Are you conducting a study in a lab, or administering a survey, or carrying out a community-based clinical trial?

  • Sketch a picture of your data collection process, to show how you plan to bring together different pieces of information.

Sketch your data story (part 4)

In the bottom right quadrant of your paper, sketch at least one type of visualization you plan to create after you obtain your data.

  • Do you envision some type of chart, like a bar, line, or scatter chart?

  • Or do you imagine some type of map?

  • If your visualizations will be interactive, try to show the concept using buttons.

  • You can add imaginary data at this stage because it’s just a preliminary sketch. Have fun!

Share your story

A group of people chatting.

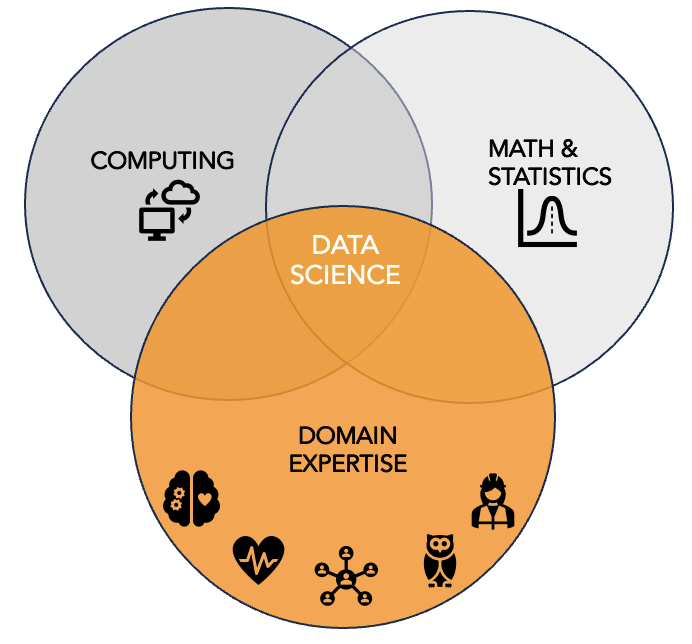
What is Data Science?


Data science is the process of using data to understand human behavior, societal trends, and social systems, ultimately aiming to make better decisions that improve individual and collective well-being.

An image depicting data science -- math/statistics, programming, and domain expertise

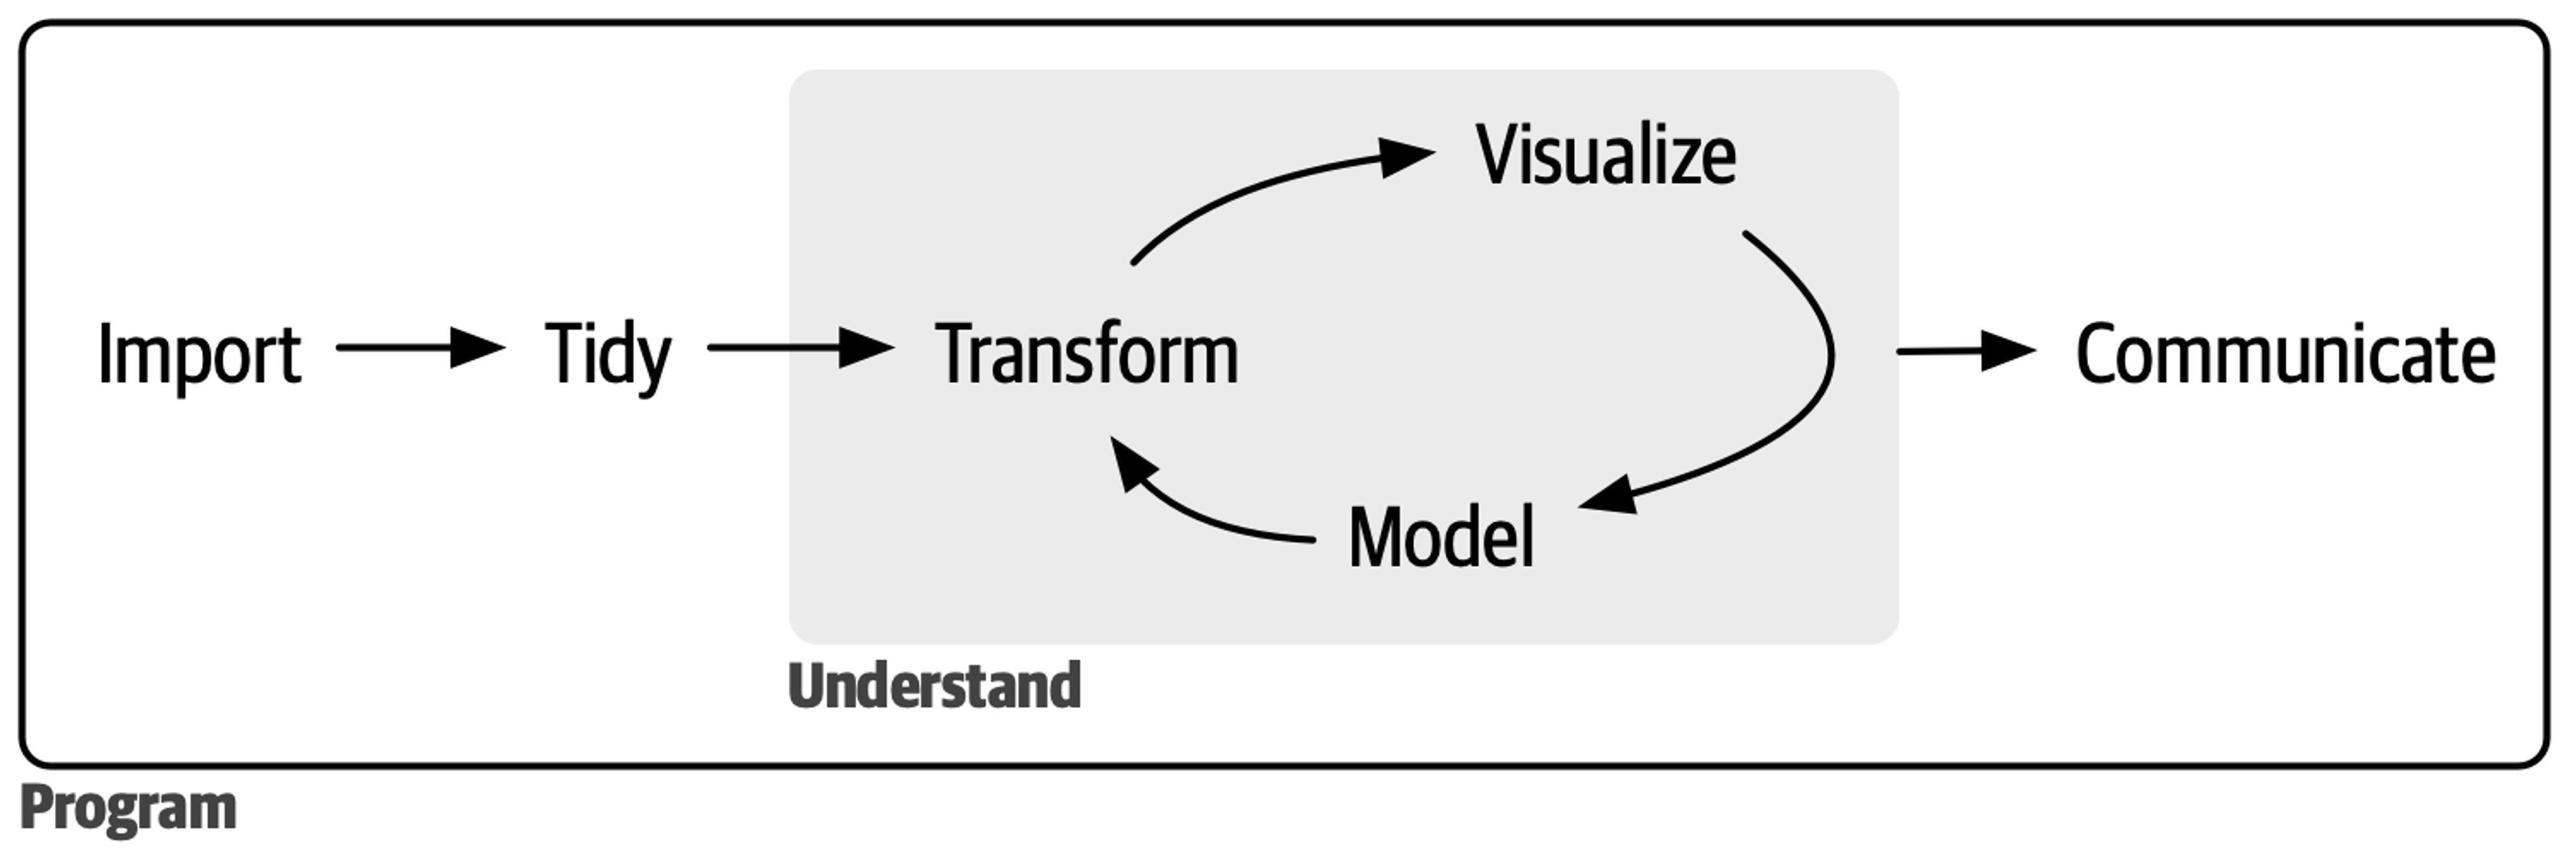
The data analysis pipeline with R

Throughout this course, we’ll use the data science process recommended by Dr. Hadley Wickham and colleagues in the book R for Data Science. The process is depicted in the figure below.

The data science pipeline: import, tidy, transform, visualize, model, communicate.