From Question to Evidence
Lecture · Module 2 · Mon Aug 24
Welcome to PSY 652
The promise of the course
This course is about turning curiosity into evidence.
Not just running code. Not just picking a test. Not just getting a p-value.
A statistical project begins with a question, becomes concrete through variables and data, takes shape in a figure, becomes more precise through models and uncertainty, and ends as a claim another person can evaluate.
Today we start at the beginning: what are you trying to learn, and what kind of evidence would answer it?
This week sets up two different foundations for the semester.
The Module and Wednesday’s lab set up your machine: R installed, the course project open, your first notebook rendered, and your work backed up to GitHub. By the end of the week, both you and your computer will be ready to do real analytic work.
Today sets up the reason for all of that machinery: the research question.
The order matters. R will calculate almost anything you ask it to. It will happily return the mean of a variable that should never have been averaged, a correlation between two quantities that have little meaningful relationship, or a p-value for a comparison that was never justified in the first place. And it will present every one of those answers neatly, without warning you that the question was wrong.
A working installation cannot protect you from a poorly framed analysis. Knowing what you are asking — and why — can.
Ice-breaker: common ground, three questions
A map for the whole course
Before we get deeper into research questions, here is the shape of the work itself — the thing every lab and both group projects will be an instance of. It comes from R for Data Science, the book we lean on all semester, and it is worth knowing on day one because it tells you where you are.
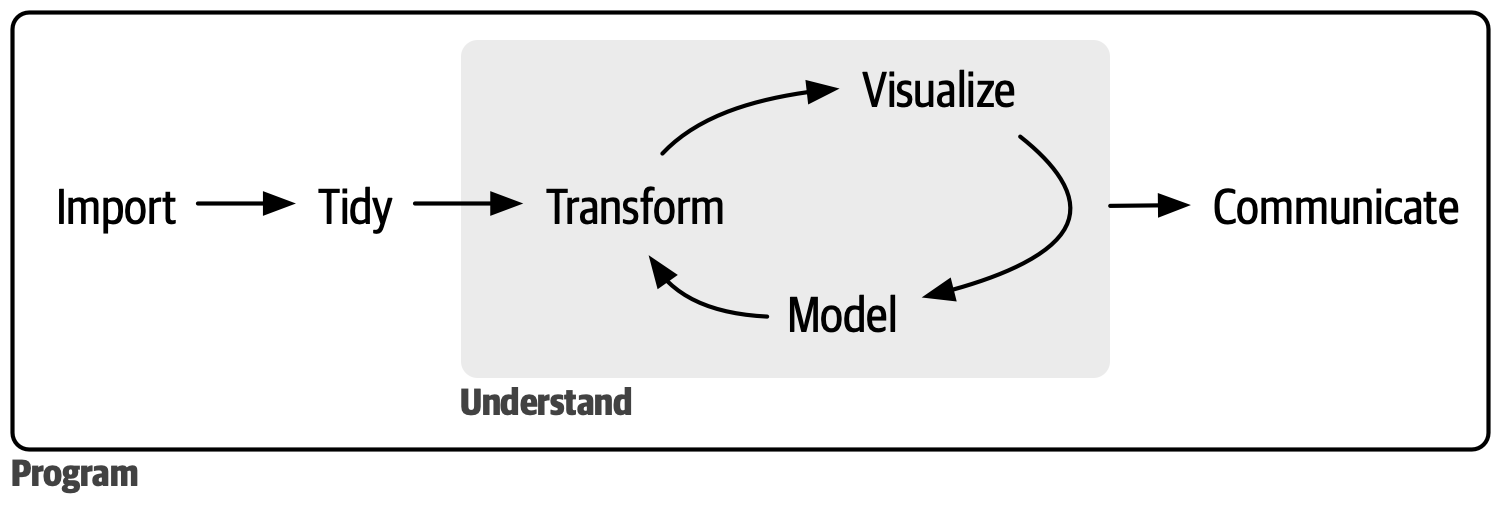
Where the course lives on this map
| Stage | Where you learn it |
|---|---|
| Program | M02 — R, RStudio, Quarto, Git |
| Import | M02 and M05 — reading .Rds files and survey files |
| Tidy / Transform | M04 — filtering, recoding, joining, reshaping |
| Visualize | M03 — grammar of graphics, and reading a chart honestly |
| Model | M06–M12 — probability, intervals, hypothesis tests, regression |
| Communicate | M05 and every rendered notebook — tables, figures, prose, and projects |
More than half of this course sits in Model — but notice how much has to go right before you get there.
The workflow tells us how analysis moves. Today’s question is what gives it direction. Every arrow above assumes you already know what you are trying to find out. Software can help you explore and refine a question, but it cannot tell you whether the question is worth asking, or whether the evidence you can realistically gather will support the claim you want to make.
Three types of inquiry
A useful framework organizes most quantitative research questions into three broad categories: description, prediction, and causal inference. The categories are not always mutually exclusive, and a single project often contains more than one kind of question. But naming the primary goal is what aligns the design, the analysis, and the claim you can defend at the end.
Three question types, one decision tool
| Type | The question asks | The answer sounds like |
|---|---|---|
| Description | What does the world look like? | “In this population, X is common / higher / associated with Y.” |
| Prediction | Given what I know, what can I expect? | “This model forecasts Y for new cases with this much accuracy.” |
| Causal inference | What would happen if we intervened? | “Changing X would change Y.” |
Description
“What does the world look like?”
A descriptive question aims to quantify and characterize the frequency, distribution, or pattern of a phenomenon in a population at a specific time or over a period. The goal is not prediction and not causal explanation — it is to document what is there.
Description is not limited to one variable at a time. A study can describe group differences, correlations, or other observed associations without claiming that the pattern will hold for new cases or that changing one variable would change the other. “Are anxiety and sleep quality associated in this population?” is a descriptive question. So is “Do flourishing scores among children differ across schools?”
Examples:
- What proportion of U.S. adolescents experienced a major depressive episode in the past year?
- How do employee engagement scores vary across departments in a large organization?
- What is the distribution of reaction times on a Stroop task in healthy adults?
What makes it description: You are summarizing what is — in one variable or across several — not forecasting unobserved cases and not claiming that one thing produces another.
Prediction
“Given what I know, what can I expect?”
A predictive question aims to forecast an outcome — either the probability that a condition is currently present or the probability that it will develop in the future. The goal is accuracy, not understanding why the relationship exists.
Examples:
- Can intake assessment scores predict which patients will attempt suicide within the next 90 days?
- Can structured interview scores predict job performance ratings at 6 months?
- Can resting-state fMRI connectivity patterns predict individual differences in cognitive ability?
What makes it prediction: You care about forecasting accuracy on new or held-out cases. A model that uses smartphone data — typing speed, GPS movement patterns, screen-time patterns — to predict depressive relapse is not claiming that slower typing causes depression. Those features may be useful because they track depression, not because they explain it.
Causal inference
“Does X actually cause Y?”
A causal question asks whether intervening on one variable would change another. This is fundamentally a counterfactual question: it asks what would have happened under circumstances that did not actually occur.
“Would this student have graduated if they had not received tutoring?” compares reality against an alternative world we cannot directly observe. Randomized experiments are powerful because they create a defensible comparison between worlds. Observational causal inference is possible too, but it requires stronger assumptions and deeper knowledge of how the data were generated.
Examples:
- Does cognitive behavioral therapy reduce PTSD symptoms more than supportive counseling?
- Does a culturally adapted prevention program reduce substance use among American Indian adolescents, compared to the standard program?
- Does implementing a four-day workweek increase employee productivity, or does the observed correlation reflect self-selection by already-productive companies?
What makes it causal: You are claiming that changing X would produce a change in Y. This is a stronger claim than description or prediction, and it usually demands a stronger design.
The key distinction
- Description tells you what has been observed.
- Prediction estimates an unknown outcome for a case you have not observed — whether that outcome lies in the future or is simply unmeasured — without necessarily telling you why.
- Causal inference tells you what would happen if you intervened.
The statistical tools overlap substantially. The same regression model (an M10–M12 topic) can describe, predict, or estimate causal effects. But the claim you can defend depends on the study design, the sampling and measurement decisions, the analytic approach, and the assumptions you are willing to argue for.
One topic, three questions
The same substantive area can generate all three kinds of question. Before we look at the answers, try it yourself.
| # | Type | Evidence it would take | What you learn |
|---|---|---|---|
| 1 | Causal inference | Randomized experiment, quasi-experiment, or carefully justified observational causal design | Whether assigning a specific reduction in social-media use would change depressive symptoms |
| 2 | Description | Nationally representative survey | The landscape — how common heavy use is, and among which groups it is most prevalent |
| 3 | Prediction | Longitudinal cohort study plus a plan to evaluate accuracy on held-out or external data | How accurately screen time identifies adolescents likely to report later depressive symptoms |
Notice: the descriptive study tells you what the world looks like, the predictive study estimates who is most likely to report later symptoms, and the causal study tells you whether one specific intervention would work. All three are valuable — but they answer fundamentally different questions and demand different evidence.
One honest caveat about that exercise. The wording gave each one away because I wrote them to give it away — reducing… lead to, what percentage… vary by, predict… at age 16. That is a fair way to learn the three categories. But a verb is a clue, not a verdict: just because those verbs are used doesn’t mean the question is necessarily of that type, or that the wording captures the researcher’s intention.
When the wording does not settle it
So the skill you just practiced is real, but it is only half of one. Reading the wording tells you what a question sounds like. It does not tell you what the researcher wants — and in practice those come apart constantly.
Consider this one:
“Do sleep problems predict depression among graduate students?”
At first glance, it sounds like a prediction question. It even uses the word predict. But three researchers could write that exact sentence and actually mean three different things:
- Description: Are sleep problems and depression associated among graduate students?
- Prediction: Can sleep problems help us identify which graduate students are likely to develop depression later?
- Causal inference: Would reducing sleep problems lower depressive symptoms?
Same sentence. Three different goals. Three different studies.
One useful version is:
“Suppose you had the answer tomorrow — what would you do with it?”
Their answer tells you a lot.
“I would report how sleep and depression are related in this population.”
→ likely description“I would use it to identify students who may need support.”
→ likely prediction“I would design or recommend an intervention to improve sleep.”
→ likely causal inference
That is the key habit: don’t classify the question only by its wording. Classify it by the claim the researcher wants to make and the decision the answer is supposed to support.
Mini-decision tool
When you build your own question, check three things:
What are you trying to learn?
A pattern, a forecast, or the effect of an intervention?What would count as a successful answer?
A clear description, accurate prediction on new cases, or a defensible causal estimate?What claim do you want to make at the end?
“These variables are associated,” “this model predicts well,” or “changing X would change Y”?
Look past the verb. Ask what quantity the study is trying to learn (later on in the course we’ll label this quantity the “estimand”), what evidence would count as success, and how the answer will be used.
Background readings
All three papers argue the same core point: description, prediction, and causal inference are different tasks that demand different designs. Please choose one and read it sometime in the coming two weeks.
- Hernán, Hsu, & Healy (2019). A second chance to get causal inference right: A classification of data science tasks. CHANCE, 32(1), 42–49.
- Ito, Al-Hassany, Kurth, & Glatz (2025). Distinguishing description, prediction, and causal inference: A primer on improving congruence between research questions and methods. Neurology, 104(4), e210171.
- Hamaker, Mulder, & van IJzendoorn (2020). Description, prediction and causation: Methodological challenges of studying child and adolescent development. Developmental Cognitive Neuroscience, 46, 100867.
The question matters as much as the math
Dr. Roger Peng drew a sketch that captures one of the most important habits in applied data analysis. He plots the quality of a research question on one axis against the strength of evidence the researcher can bring to bear on it. The goal is a sharp question answered with strong evidence.
We often imagine we start with a clear question and weak evidence. In practice, we usually start with a question that is vaguer than we realized. The work is to improve both: sharpen the question and strengthen the evidence. Piling on more statistics without sharpening the question does not get us to the goal.
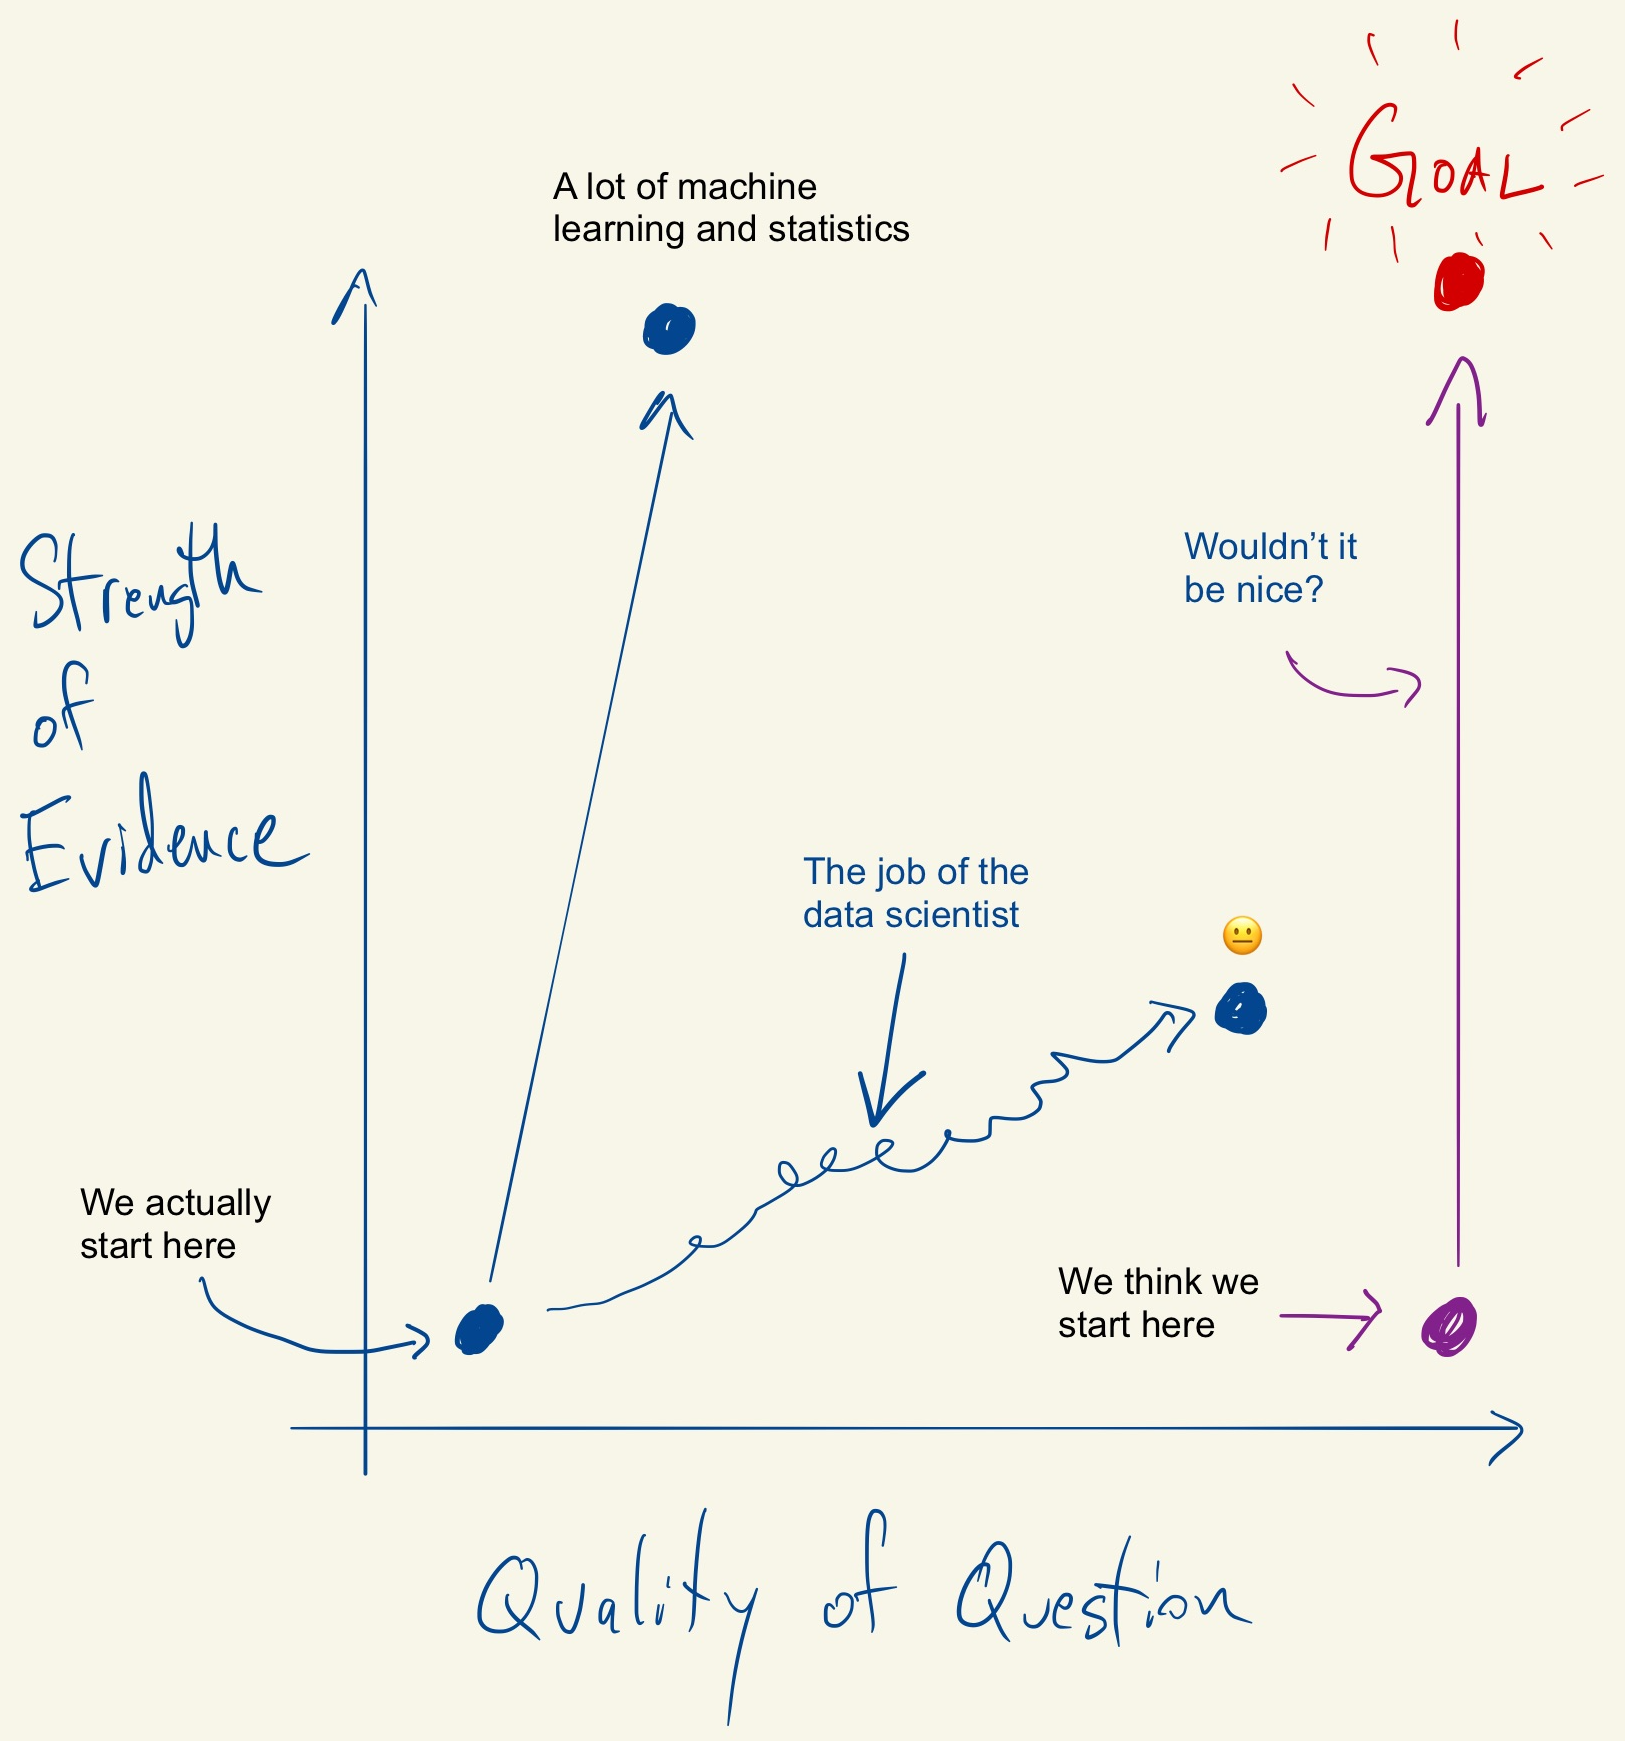
This is why the first class session spends time on the question itself, not on statistical machinery. The activity today moves you along the x-axis: it sharpens what you are asking before we pick a tool. Later weeks move you up the y-axis by adding stronger analytic tools. Neither move alone gets you to the goal.
Question Clinic: first draft, not final draft
We have worked with questions other researchers wrote. Now we turn to the more interesting — and harder — version: your own.
You do not need a perfect question today. In fact, you probably should not have one yet. You need a question concrete enough that another person can help you sharpen it.
A good first draft does not settle everything. It gives you something to test:
- What am I trying to learn?
- Who is the answer supposed to be about?
- What would I actually measure?
- What kind of claim do I want to make?
- What would I do with the answer if I had it?
Keep this card
Next Monday, we will take this question and ask: what would the answer look like? Before we calculate anything, we will sketch the figure your question is asking for.
Keep working on it in Canvas
Discussion post · due before next Monday
Fifteen minutes is enough to start a research question. It is nowhere near enough to finish one.
Take what you wrote today, give yourself time to think, and post a fuller version to the Week 1 discussion board on Canvas. The post is ungraded. Its purpose is to help you slow the question down, make early decisions explicit, and see the range of questions your classmates are bringing into the course.
There is no expectation that this becomes your thesis question or even that you keep it all semester. Think of it as a first draft of your thinking — a starting point you will return to later with better statistical vocabulary.
Part 1 · Your question
The question
State your research question in one complete sentence.Type of inquiry
Is your question mainly descriptive, predictive, or causal? Explain briefly what in the question — or in your intended use of the answer — tells you which one it is.Use of the answer
Suppose you had the answer tomorrow. What would you do with it?- Would you report a pattern in a population?
- Would you use it to forecast or identify new cases?
- Would you recommend changing, treating, or intervening on something?
If your answer here does not match the type of inquiry you named above, that is useful. Say what feels mismatched.
Population
Who, exactly, is the question about? Try to define a population you could realistically imagine recruiting or sampling from. Also name one group that is not included in your population.Variables
What would you actually measure? For each important variable, say how you would operationalize it and what it might look like in a dataset.For example: not just “sleep,” but “sleep quality score on the PSQI, 0–21”; not just “social media use,” but “minutes of social media use after 10 p.m.”
What would count as a successful answer?
What kind of result would help you answer the question?Examples: a proportion, a group difference, a correlation, a trend over time, a prediction accuracy measure, or an estimated treatment effect.
Reframe it
Rewrite your question as each of the other two types of inquiry. You may never want to conduct those studies; that is fine. The point is to feel how changing the claim changes the question.
Part 2 · Visit someone else’s question
Reply to one classmate working in a different research area from your own. Your job is not to redesign their study. Your job is to help them see the question more clearly.
Choose one useful clarification to offer.
You might respond to:
- whether the wording matches the type of inquiry they identified
- whether their intended use of the answer matches the claim type
- whether the population is specific enough to imagine sampling from it
- whether one important variable needs clearer operationalization
- whether they are missing a timeframe, comparison group, baseline measure, or follow-up outcome
- whether you would classify the question differently, and why
End your reply with one sentence:
The thing I would sharpen first is _____.
Keep this post. In the final week of the semester, you will come back to it and look at the question again with a semester’s worth of statistical thinking behind you.
Bridge to the syllabus
Why the syllabus comes next
You just drafted the kind of question this course is meant to help you answer. Now let’s look at the structure that will get you there.
As we go through the syllabus, listen for the workflow:
- Pre-studies prepare the vocabulary.
- Labs turn ideas into code and rendered notebooks.
- Projects ask you to complete the full workflow with other people.
- Feedback and revision are part of the work, not evidence that something went wrong.
The course structure is not separate from the research question. It is the support system for learning how to answer one well.
Looking ahead
Next week, we will take the question you drafted today and ask a new question:
What would evidence for this question look like?
That is where data visualization begins. A figure is not decoration added after the analysis. A good figure is a first draft of an answer.